Welcome back to The Argument’s poll series, where we survey Americans on the issues everyone’s fighting about. The full findings and crosstabs are for paid subscribers below. Our previous surveys have asked about war, elite perception, AI, crime, and much more.
You can see every single poll published by The Argument here.
Our full methodology can be read here.
This is what it looks like when the bottom falls out for the Republican Party.
Across the 14 national polls The Argument has conducted since last year, I have never seen a worse poll for the Republicans than this one. They trail Democrats by 9 percentage points with registered voters on the generic ballot — and by 11 points with the likely electorate. That represents a 13-point swing from 2024.
If you’re searching for ways to explain the blue wave, you don’t have to look too hard. When voters are asked directly which party would do better on the issues that are most important to them, Democrats hold an 11-point edge.
In 2022, it was Republicans who led on this question1 by 11 points, according to Gallup. In 2024, they continued to lead by 5.
A huge portion of this sea change can likely be explained by economic sentiment: Just 19% of the likely 2026 electorate thinks their financial position has gotten better over the last two years, and 42% think it has gotten worse. With a Republican trifecta governing, it’s no surprise that voters now look to the out-party for hope, especially as 63% believe that most Americans are doing worse financially than they were two years ago.
Between this and the myriad of other problems Donald Trump has caused for himself and for Republicans, Democrats now hold the advantage on almost every important issue of the cycle. On the economy, healthcare, foreign policy, and corruption, Democrats hold substantial trust edges.
Voter trust in Republicans has completely evaporated — effectively making some relatively pedestrian numbers for Democrats look phenomenal.
Just 35% of voters think leaders of the Republican Party understand the problems Americans face in day-to-day life somewhat or very well; for Democratic leaders, this number is a comparatively rosy 47%. Sixty-four percent of voters now rank cost of living as one of their top two issues. And while only 32% say it’s a top-two issue for the Democratic Party, that’s still far better than the 14% of voters who think this is a top-two issue for the Republican Party.
In other words, voters simply don’t think Republicans understand, care about, or talk about what’s important to them. If given a candidate who says they are “focused on making things more affordable,” 44% of voters would think they are more likely to be a Democrat, while just 25% would think they are more likely to be a Republican.
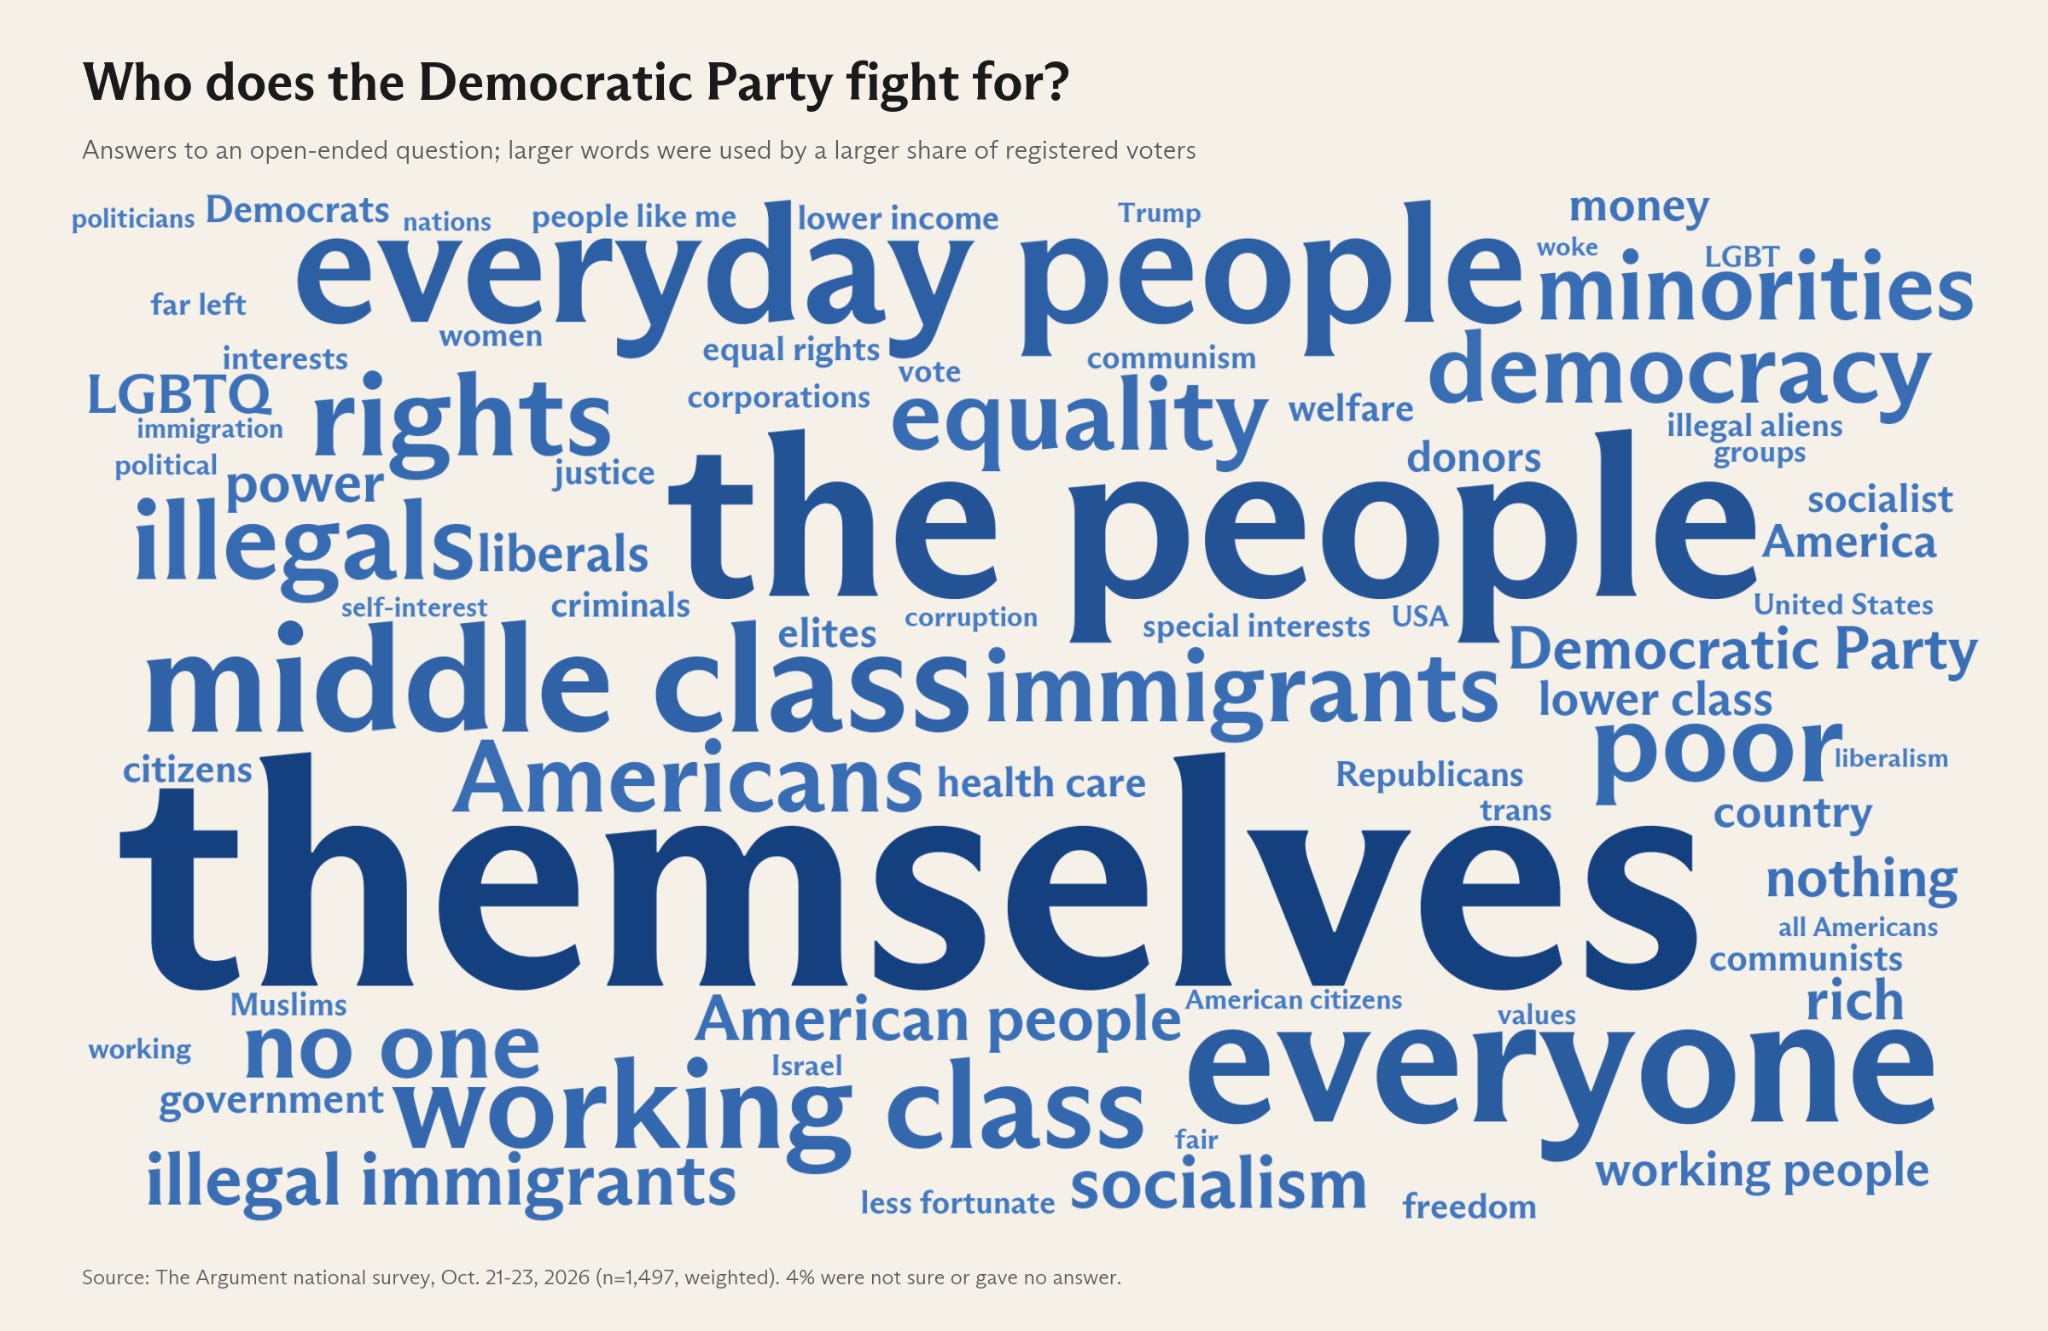
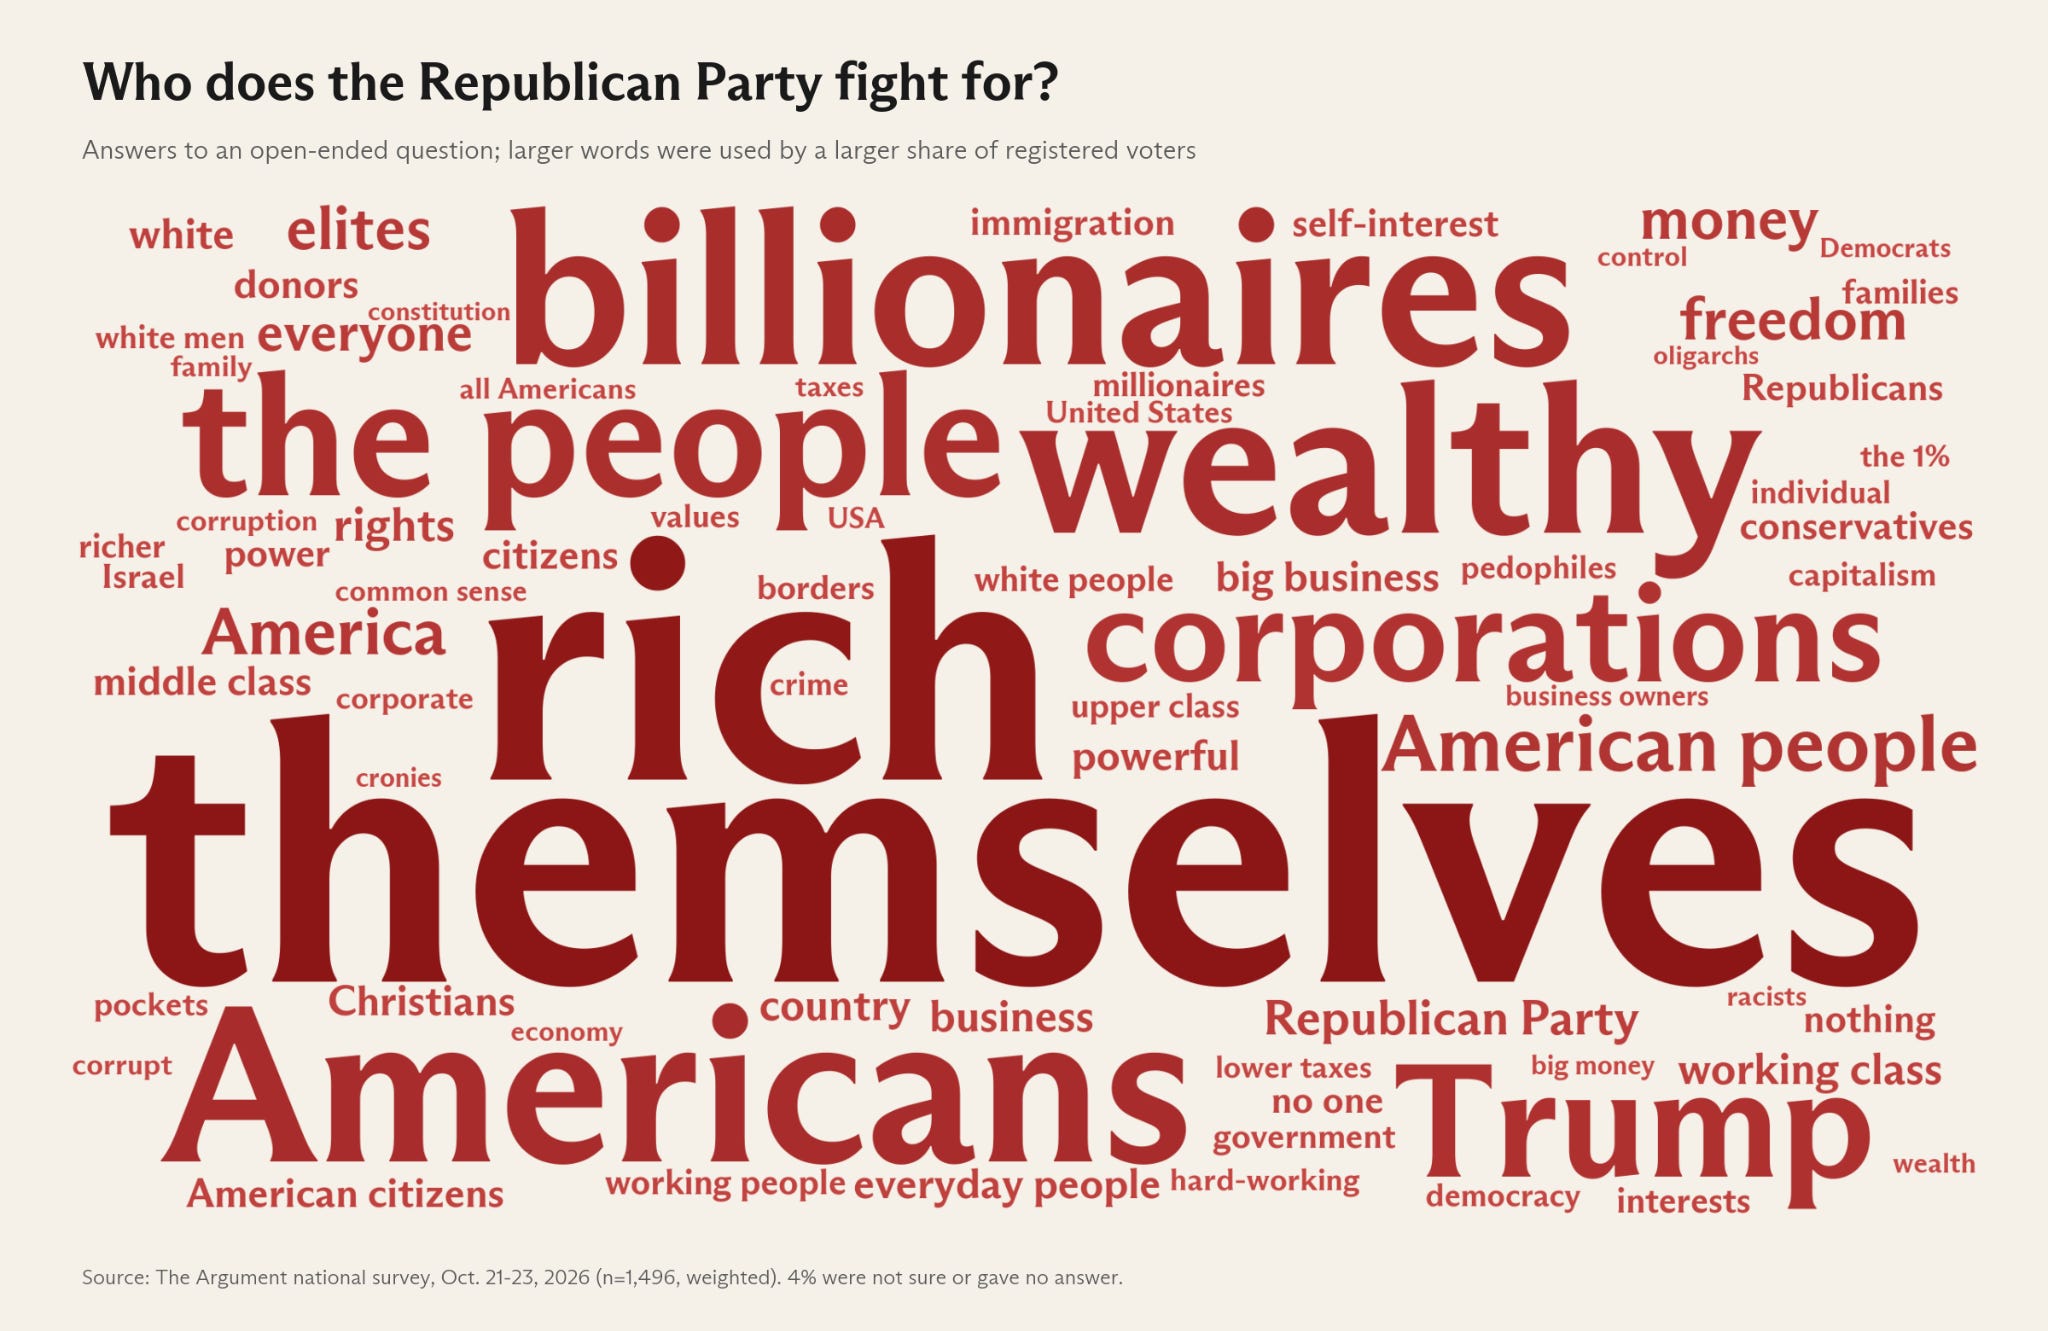
To hammer home this point, it’s probably useful to look at a word cloud generated from our survey, where respondents were asked who they think the Democratic and Republican parties fight for. The Democratic graphic suggests a fairly mixed picture — the largest word is “themselves,” but there’s also a healthy dose of “people” and “middle class” and “working class.”
Look at the Republican one, though, and it’s nothing short of horrifying for the party.
The lack of trust goes beyond a simple misalignment on issues. Voters are also less likely to trust Republican leaders to change tack on policies that don’t work.2 Just 27% say that they believe party leaders would change their approach in a situation where their policy wasn’t working. That somehow makes the comparable 34% figure for the Democratic Party look good.
U.S. elections are, ultimately, a choice between two parties. That’s partly why Democrats are now the party that is seen as more competent, more compassionate, less extreme, and more focused on the most important issues; they are the sole alternative to Republicans.
While these results are certainly striking, I don’t think I could call them surprising. For nearly two years, the Trump administration has seemingly made it a goal to actively thumb its nose at voters. Trump has sent ICE raids to communities that voted for him, established tariffs, and spiked gasoline prices; but the administration has not even attempted to address the key concerns of voters. The backlash has been sharp, but it is nothing if not predictable.
If the cumulative results of our polling are borne out on Election Day, it would mark the largest defeat that any party has seen in over 40 years. The implications of this are staggering — an open seat whose district voted for Trump by 10 in the last presidential election would now be expected to (somewhat comfortably) vote for a generic Democrat over a generic Republican.
Make no mistake: This is considerably worse for Republicans than even our model — which already forecasts Democratic victories in the House and Senate — suggests.3 If this situation matches the reality on Nov. 3, Democrats would likely be on track for 53 Senate seats at minimum and could get up to 56. In a D+11 year, the party would be a decent bet to flip a half-dozen Senate seats that Trump won by double digits. There hasn’t been a midterm like this in modern memory.
If Republicans want to find a culprit for this, they need only to look at the White House. This month, our survey finds Trump 23 percentage points underwater with the likely electorate.
There just isn’t any precedent for the incumbent party doing remotely well when the president is this unpopular. (By comparison, when Democrats won the 2018 election by 7 percentage points in Trump’s first term, the president’s net approval was only 11 points underwater.)
But even though our poll’s findings represent a sea change in the landscape, they don’t suggest the public has forgotten what it disliked about Democrats from 2024.
In fact, in our poll, several of the Democratic Party’s vulnerabilities from 2024 remain. Nearly half of the electorate thinks the party is “too far to the left.” More voters describe Republicans as “strong” and “bold” than they do Democrats, and Republicans retain slight edges on immigration and crime. Republicans even lead Democrats on self-expressed party ID by 1 point.
That’s what makes this poll even worse for Republicans. This isn’t some overwhelmingly blue sample that fails to reach or represent Trump voters. In this case, voters actually agree with several critiques of the Democratic Party. But even though they don’t like the party, they’re voting Democratic because they absolutely loathe Republicans.
METHODOLOGY NOTE
Our poll was fielded between Oct. 21 and 23, 2026. We surveyed 1,549 registered voters across the nation; 1,501 completed the survey, while 48 gave partial responses, completing at least until the generic congressional ballot question, where they were asked which party’s candidate they intended to vote for in November.
The sample was weighted to be representative of the universe of registered voters in the United States by race; age; gender; education; census region; race by gender; age by gender; race by education; modeled presidential partisanship by age, education, and gender; and 2024 vote choice. Questions up until the generic congressional ballot were weighted including partial interviews. Questions after the generic ballot were weighted separately to the same parameters, but using only the complete interviews.
The margin of sampling error was plus or minus 2.5 percentage points. The design effect of the survey, which measures the loss of statistical precision due to weighting and design, was 1.20. Accounting for the design effect, the full margin of error was plus or minus 2.7 percentage points.
This iteration of The Argument’s national survey produces estimates of both registered and likely voters for the 2026 midterm elections. The likely voter screen takes every respondent’s demographic and voting history and calculates an initial probability that they will vote in 2026. It then aligns this with probabilistic turnout scores from self-expressed vote likelihood and rakes this to the likely 2026 electorate, calculated via historical demographic turnout data from a Catalist voter file sample, in order to estimate their likelihood of voting.
This survey was designed and weighted by The Argument. Data collection was performed by Verasight, and voter file data and weighting targets were obtained from Catalist. A full methodology statement is available on the last page of the survey PDF. A detailed explanation of how our surveys work is available here.
Thanks to Josh Kalla, Amanda Iovino, Guy Molyneaux, Charlotte Swasey, and Carroll Doherty for reviewing this month’s polling language. As part of The Argument’s polling advisory committee, these experts have provided comments to ensure the rigor and objectivity of this polling project. They are not responsible for the ultimate language choices made by The Argument, and all errors are our own.
Recommended reading:
Gallup polled all Americans, where our polls only tracked registered voters. Gallup’s question wording was also different from ours.
Given the way Trump and the Republicans have handled the historically unpopular war in Iran, as well as the tariffs, it’s really quite hard to blame the voters for feeling this way.
This is mostly because our model aggregates polling and other data across a lot of different sources — it’s more sophisticated and thorough than any single poll, no matter how good that poll is.